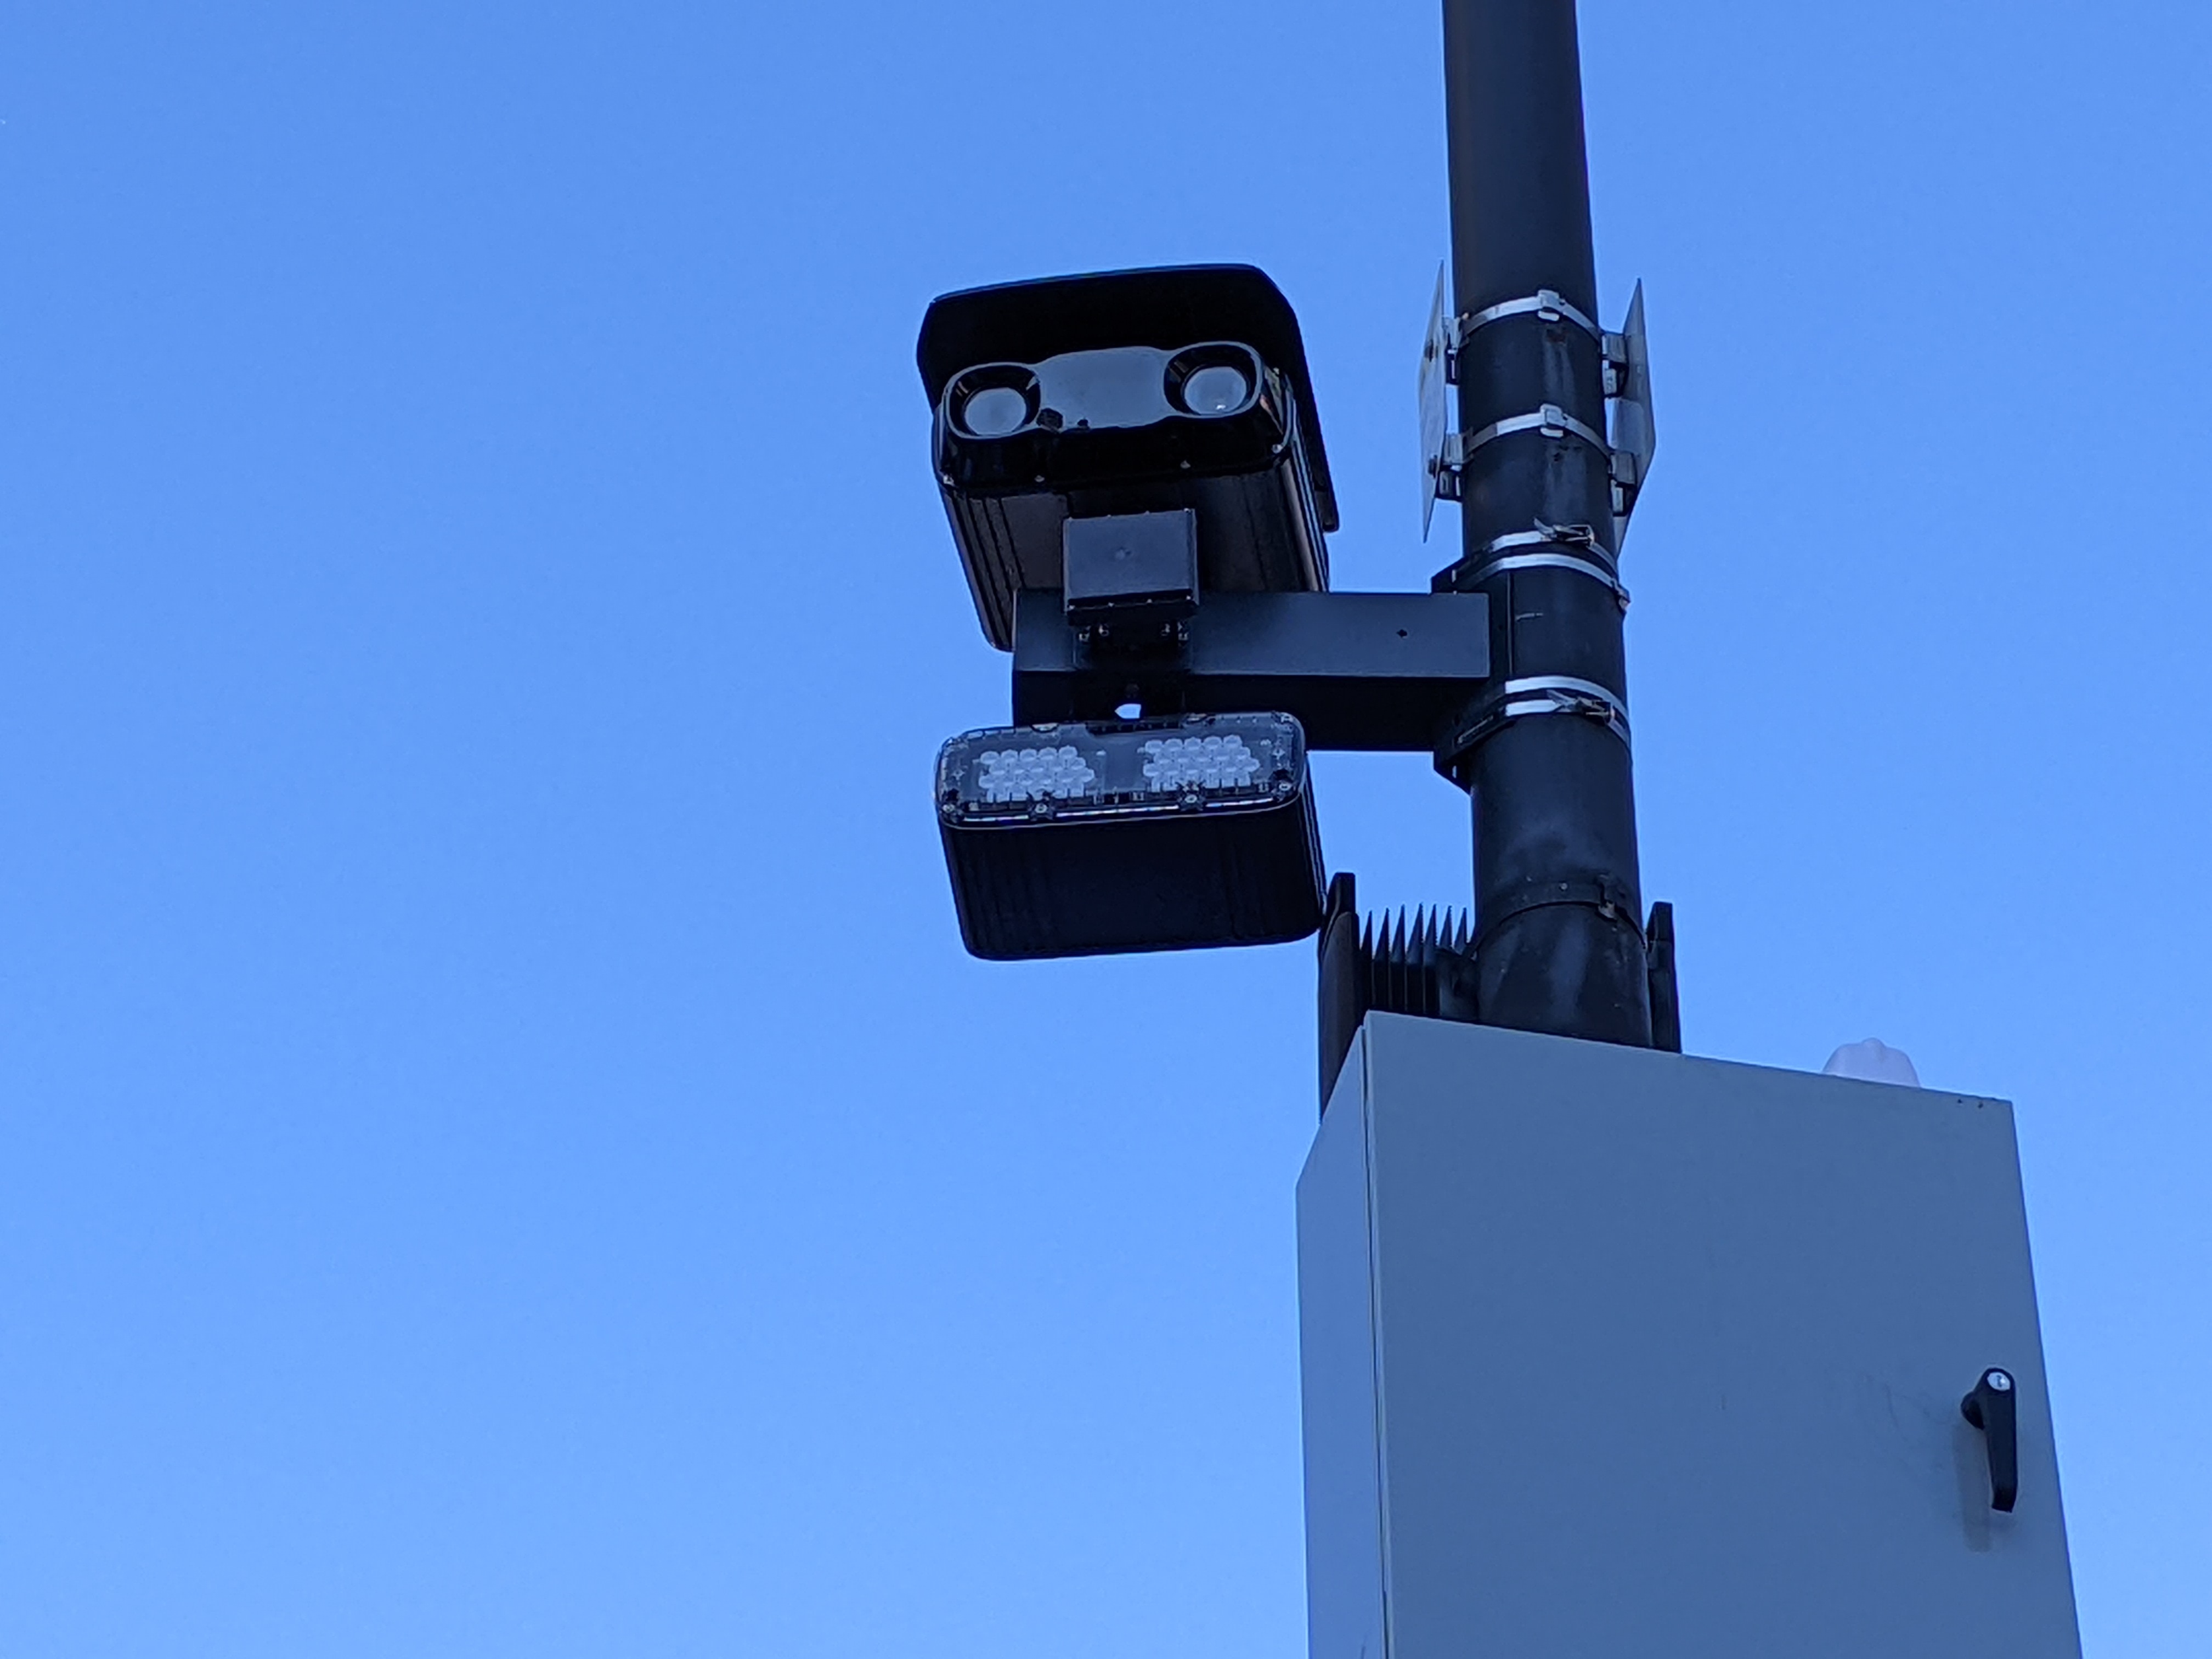
Oakland's own before-and-after counts show speed cameras cut extreme speeding about 70 percent
A city transportation department evaluation using tube counts across three summers finds far fewer drivers going 11 mph or more over the limit at camera sites, though it measures speeds rather than crashes.
This is not our reporting
This story was reported and published by Streetsblog San Francisco. What follows is our summary of it, and why it matters for people writing policy.
Read the original at Streetsblog San Francisco ↗Our summary
Oakland's transportation department measured vehicle speeds with pneumatic tube counts before and after installation, comparing the summers of 2024, 2025 and 2026. Across 18 camera locations, the reporting says, vehicles traveling 11 mph or more over the limit fell about 70 percent on average — roughly 20,000 fewer speeding vehicles a day — with the steepest drop on 7th Street, from about 1,700 to 150. The 85th percentile speed declined at every site, by as much as 10 mph on Hegenberger Road. Note what the evaluation covers: speeds, not crashes or injuries. Advocates quoted argue cameras cannot substitute for physical redesign, and press for transparency on revenue.
Read the full story at Streetsblog San Francisco ↗
More from The Effective
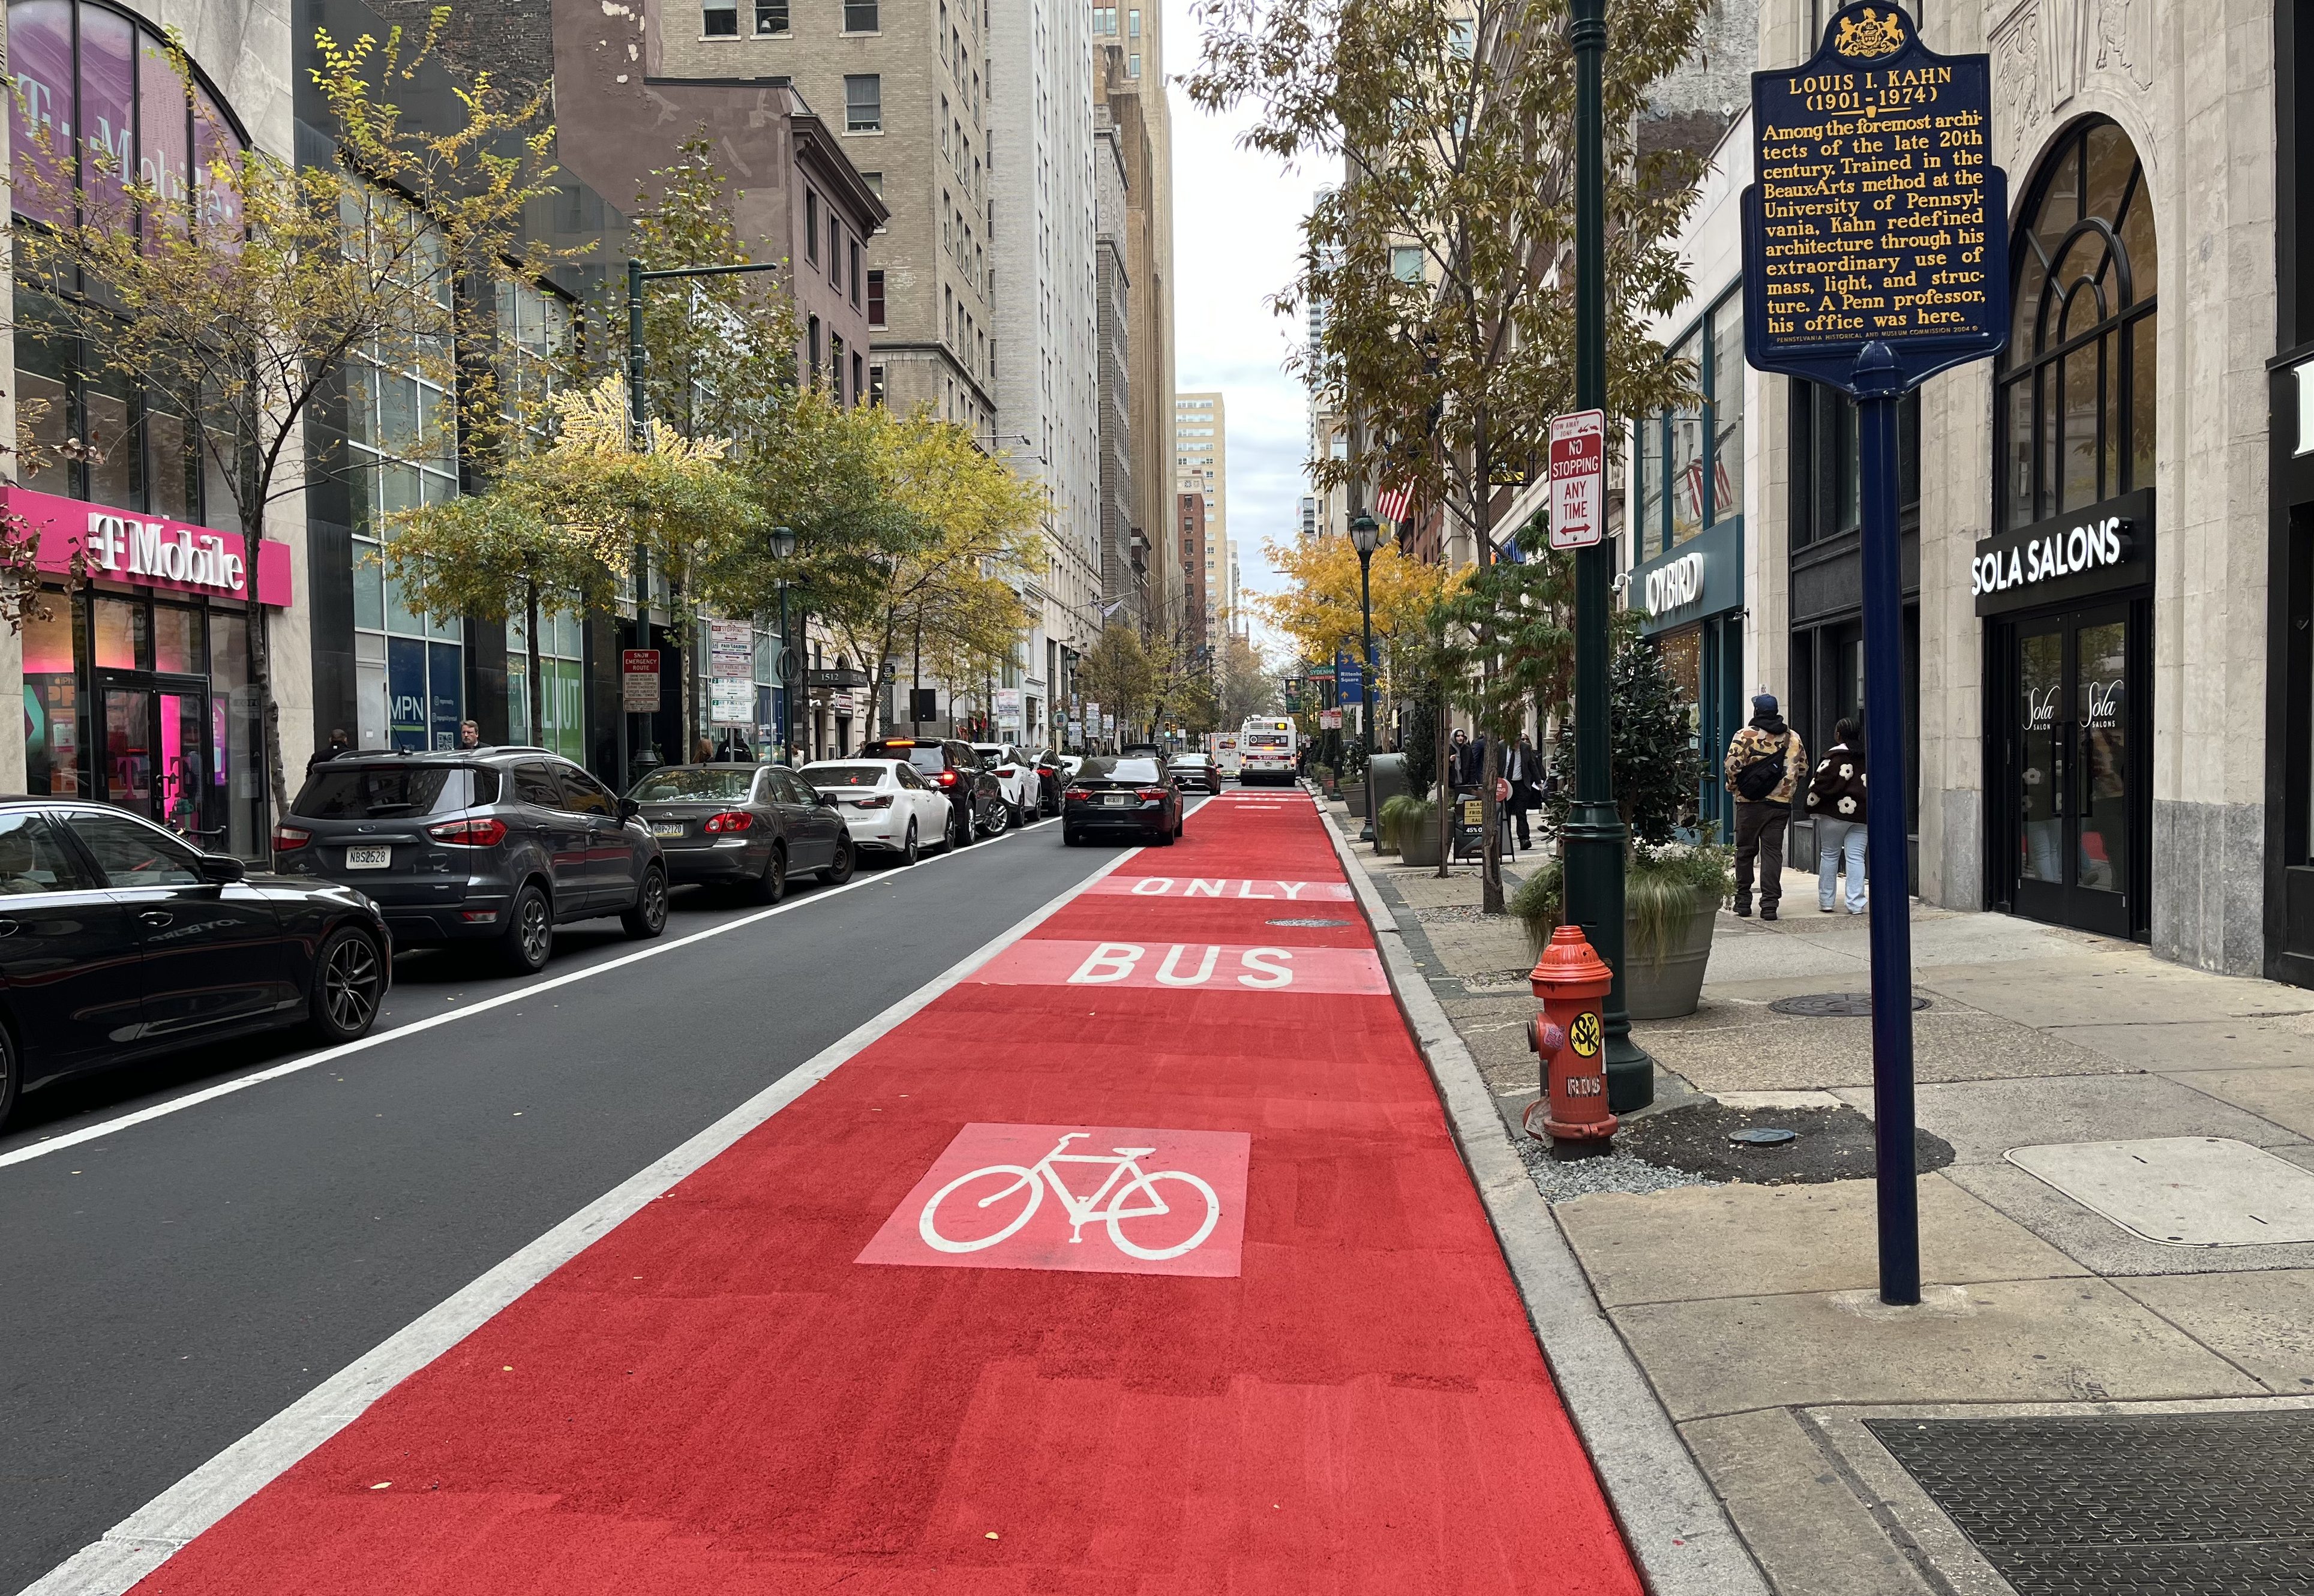
Camera-enforced loading zones in Philadelphia nearly doubled freight use of the curb
Fifteen months into an automated curb enforcement pilot, the reporting finds delivery vehicles using Center City loading zones up 97 percent and traffic moving faster, with safety effects still unmeasured.
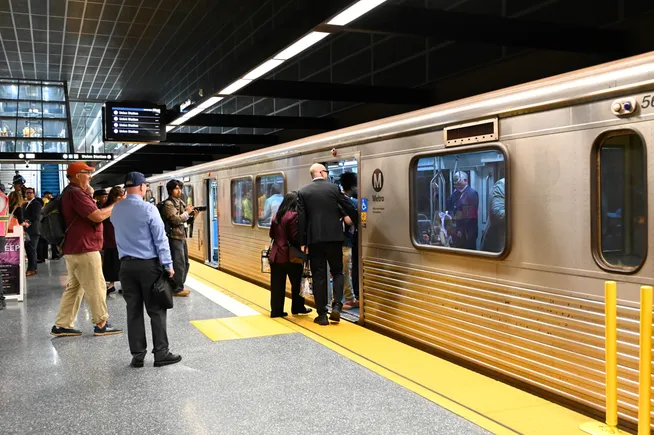
LA Metro's outreach division coincides with falling crime and rising ridership
A dedicated care-based services division pairing homelessness outreach with public safety staff accompanied an 8-month ridership rise, a 6.7% drop in violent crime, and a 57% decline in unhoused riders on the system.
Combining free fares with faster routes multiplies transit ridership gains
A national report finds cities that speed up buses and drop fares together see bigger ridership boosts than doing either alone, with some agencies finding fare collection costs more than it collects.